Everyone in your organization can take advantage of intuitive dashboards and interactive reporting
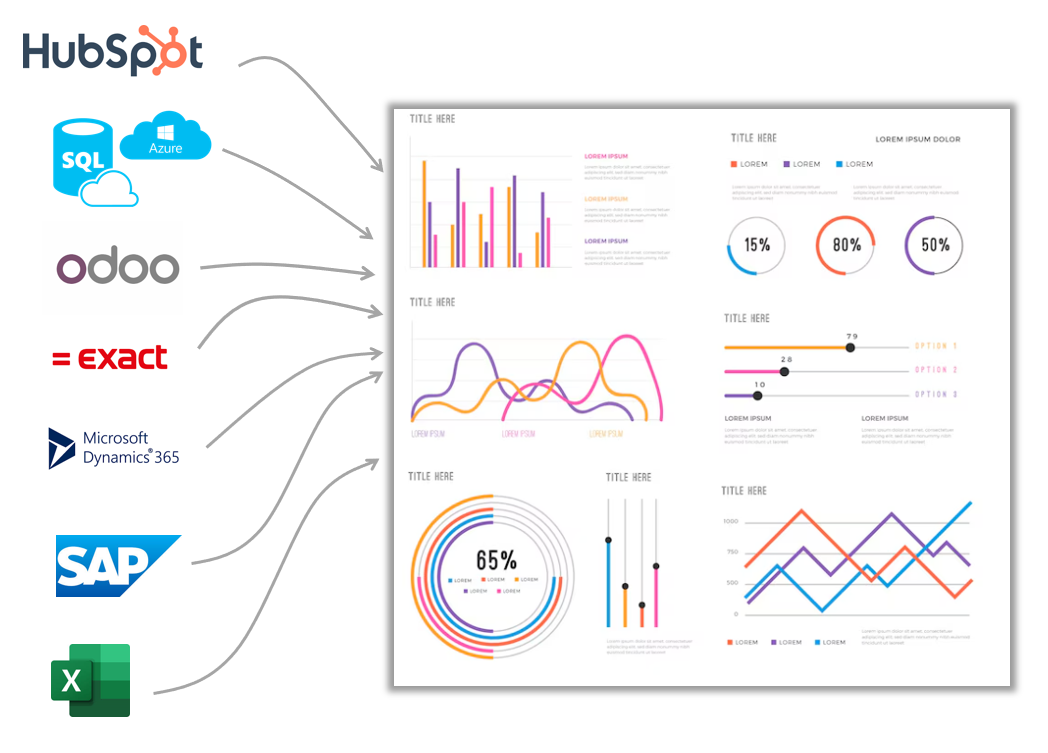
Multiple datasources combined into one dashboard
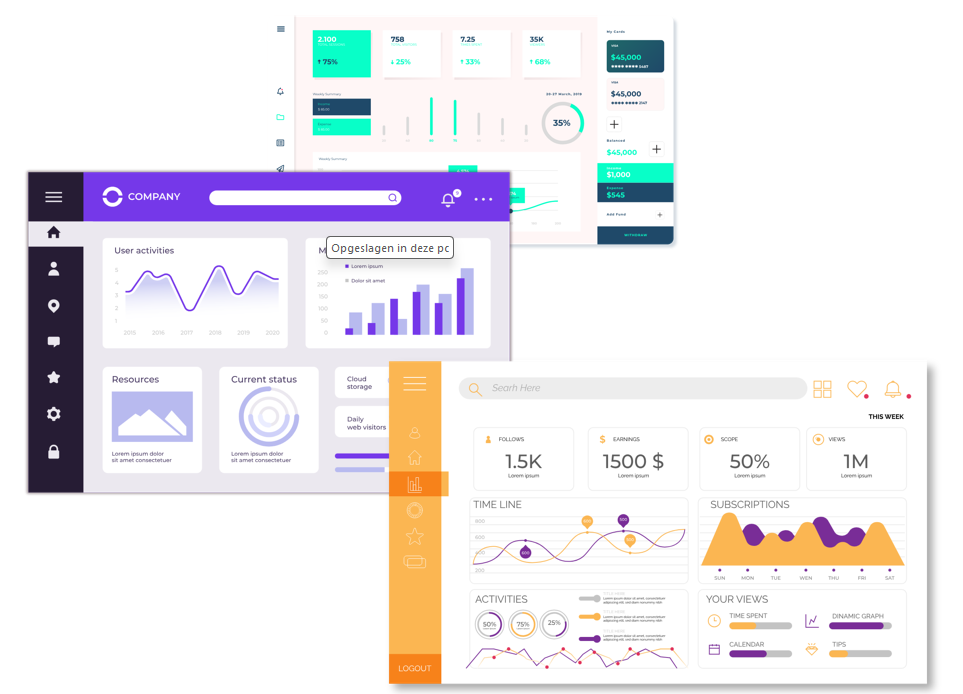
Dashboards for a variety of domains
Visualizing data by dynamic dashboards will give enormous benefits across all domains within your organization. It will transform your data into paterns you haven’t discoverd yet.
Different audiences have different types of data and therefor different needs, preferences, and expectations for data visualization.
Marketing: Track campaign performance, customer behavior, and market trends in real-time to optimize strategies and boost ROI.
Finance: Gain a clear, comprehensive view of financial health, streamline budgeting processes, and make informed investment decisions.
Sales: Monitor sales pipelines, conversion rates, 360-view on your customer and driving revenue growth.
Management: Stay on top of KPI’s, operational metrics, and employee performance, ensuring strategic alignment and operational efficiency.
…

Time to Modernize your Data Analytics & Visualization landscape
if you’re struggling to:
Finding a single version of the truth across your company
Viewing a real-time view of your data at any time
Keep controle of the wildfire of reports/exports stored on local devices
Bring the right data to the right team within your company
Combine & link different data sources
Make informed decisions based on facts
Spot what actions needs to be taken
Discover patterns in your data
Improve data quality and accuracy
Clearly communicate complex data, including big data

“It all begins with an idea. Maybe you want to launch a business. Maybe you want to turn a hobby into something more. Or maybe you have a creative project to share with the world. Whatever it is, the way you tell your story online can make all the difference.”
— Squarespace


